
We work with our clients to understand their data presentation needs and then build products to suit their needs. This work is often linked to our work on statistical analysis and dashboards.
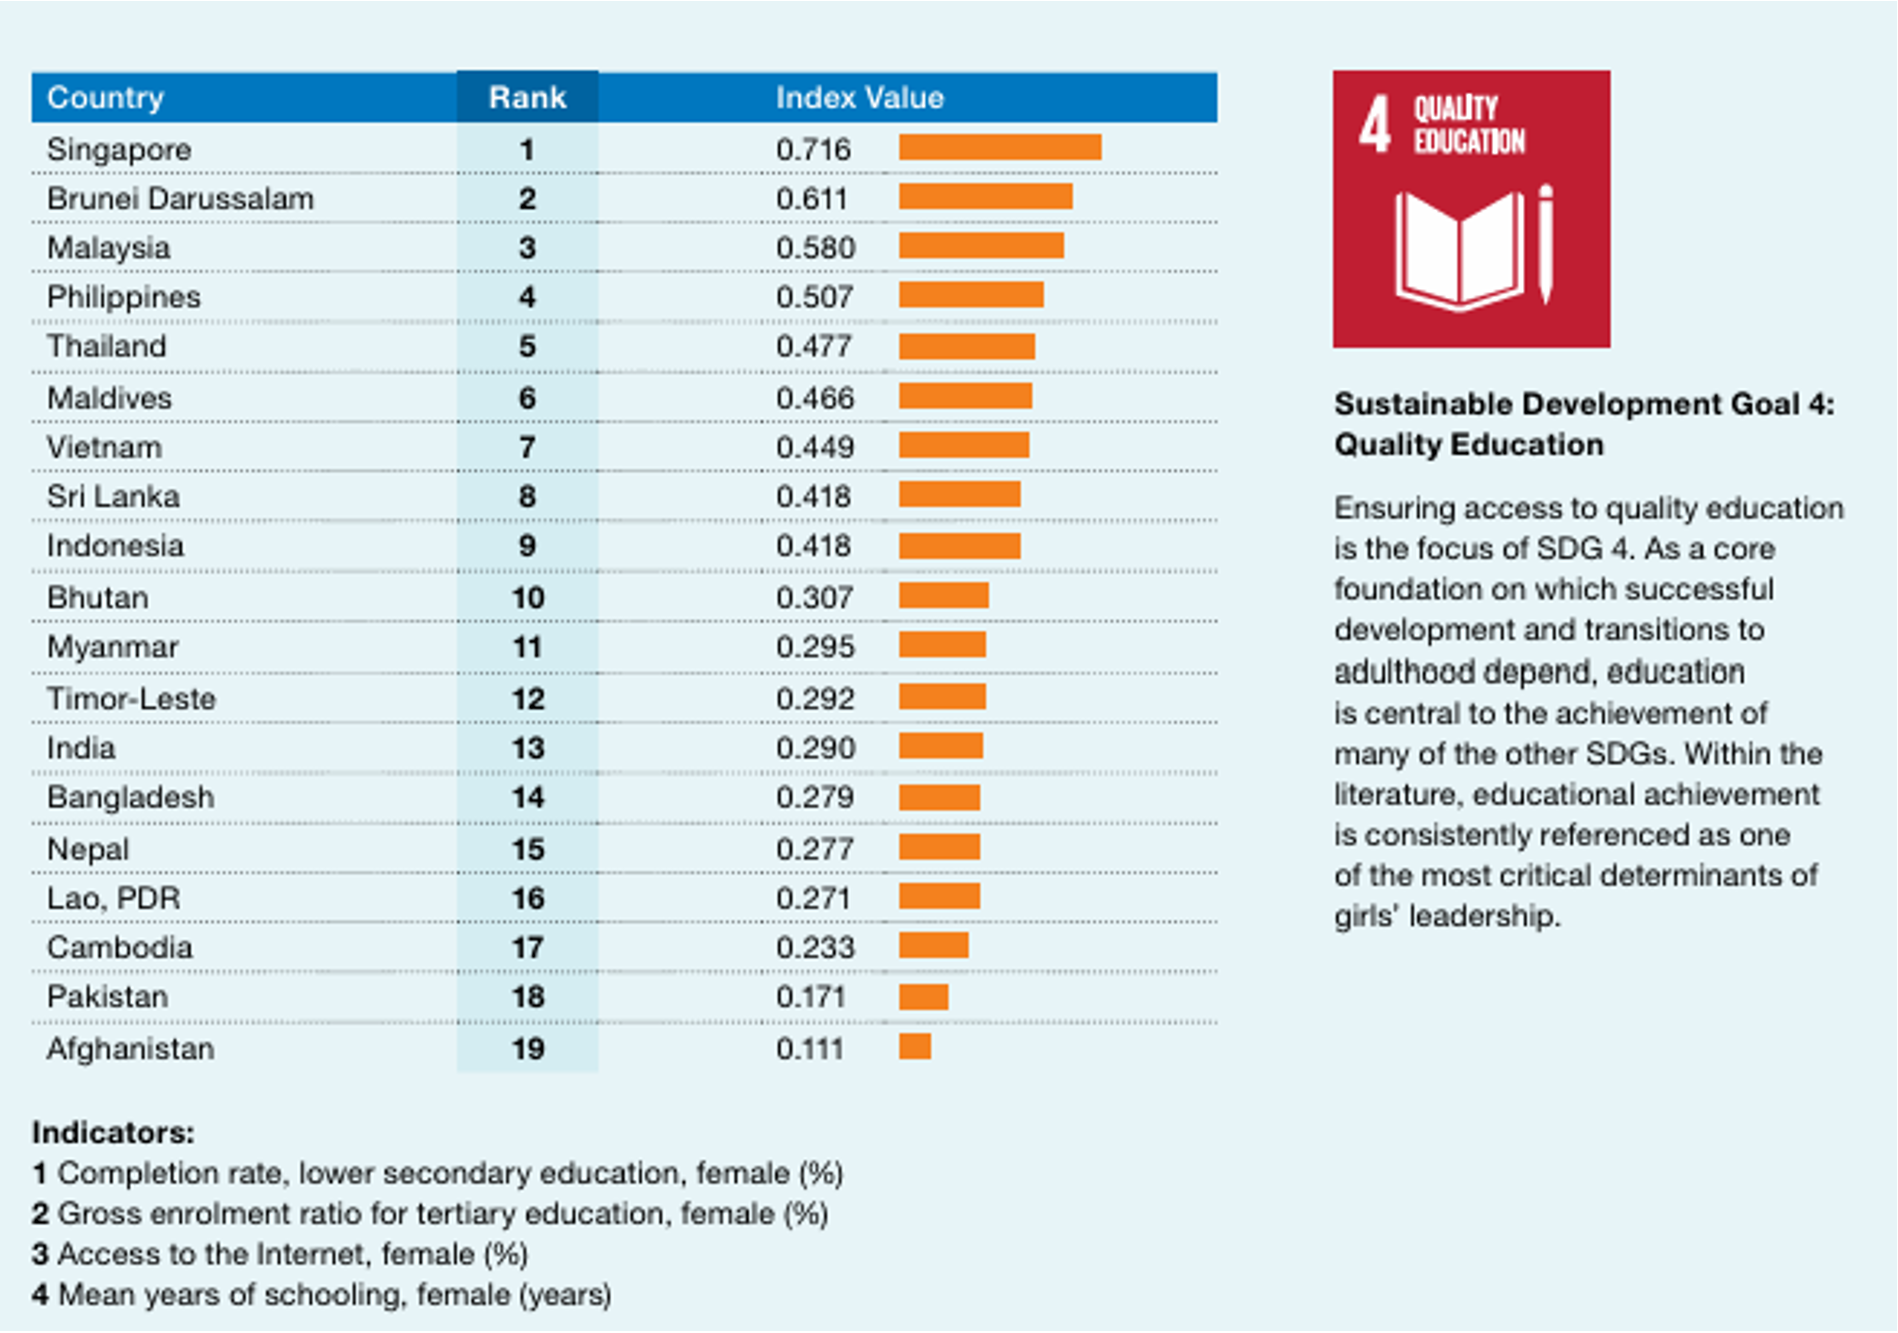
We contributed to a project for PLAN International to create a Girls’ Leadership Index for the 2020 Asia Girls Report. PLAN wanted to be able to compare data across 19 countries and two regions in Asia for six domains: education, economic opportunities, protection, health, political voice and representation, and laws and policies.
Stats4SD worked with the PLAN consultant to define the domains, create the methodology for the indices and build the database. The indicators were drawn from internationally recognised sources available online, with Sustainable Development Goal (SDG) indicators prioritised to support regular updating of the Index.
Stats4SD created an agroecology finance assessment tool for the Agroecology Coalition to answer the questions “how agroecological is my funding portfolio?” and “how do I compare with others?”
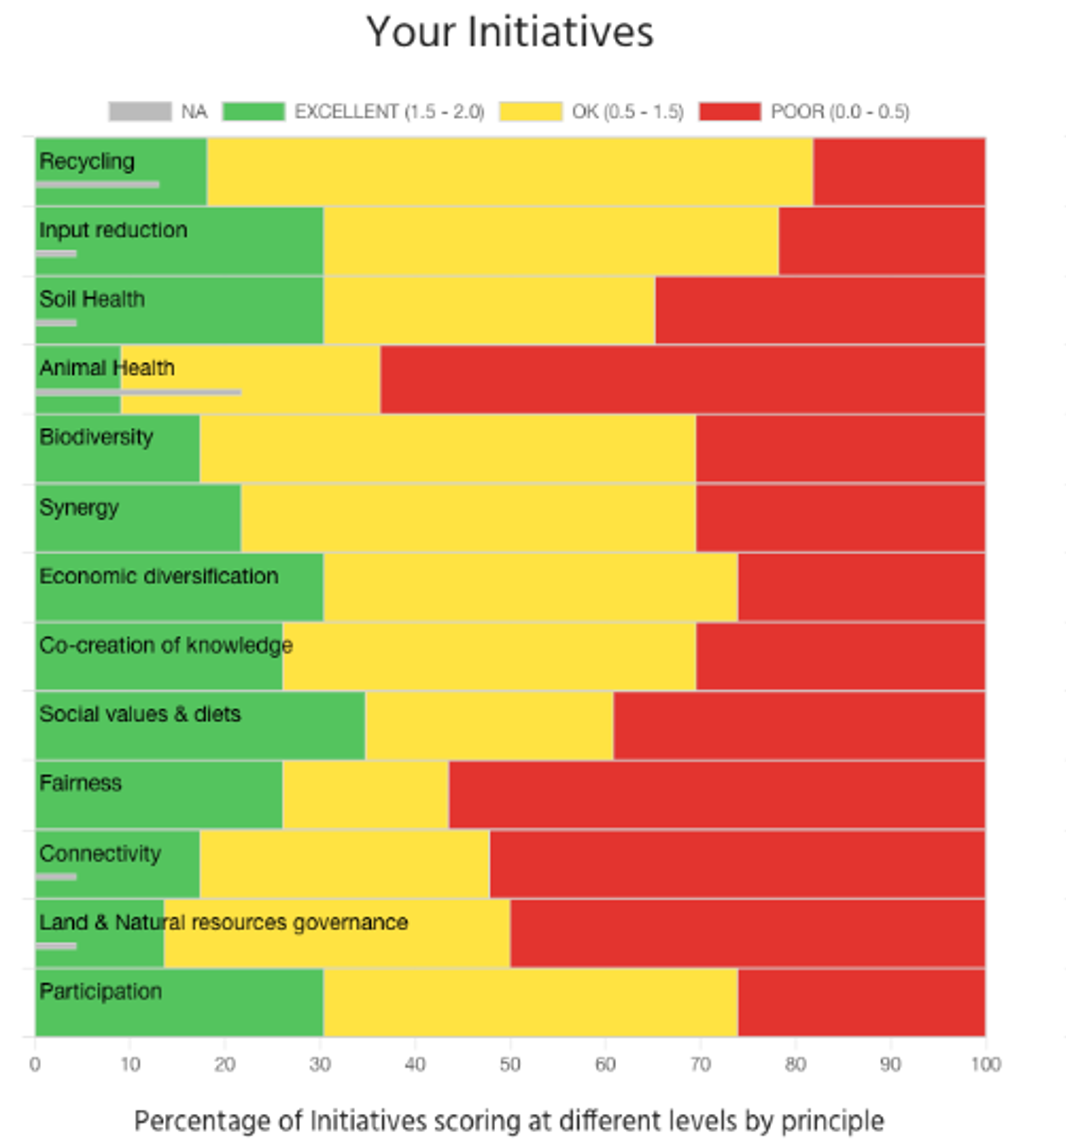
The tool comprises a set of indicators and data visualisations that institutions can use to evaluate their own initiatives against those of others (aggregated to protect confidentiality). To determine how agroecological a recipient of a funding initiative is, we used the Agroecology Coalition’s Agroecology Assessment Framework which is based on the 13 agroecology principles of High Level Panel of Experts (HLPE) on Food Security and Nutrition of the United Nations Committee on World Food Security.
The agroecology finance assessment tool shows the indicators for all initiatives and all agroecology principles together. It also provides detailed performance indicators for each initiative in relation to each agroecological principle.
You can find information about the agroecology finance assessment tool and methods here. To use the tool itself, registration is required.
Stats4SD also contributed to the development of the Agroecology Assessment Framework – see article here.
To learn more about how we can help you, please contact:

Operations Director and Senior Statistician
Operations Director and Senior Statistician
Alex leads our work on Monitoring and Evaluation (M&E), impact assessment and the development of indices. He is also an expert in surveys and statistical analysis. He has over 25 years of experience in research, research methods and teaching statistics. At Stats4SD, Alex has worked with projects in areas such as food and agriculture, international development, health and nutrition, education, and climate change. For quantitative studies, his expertise guides the process from the design stage to the reporting of results, as he supports areas such as survey design, sampling, digital data collection, creation of analysis plans and complex statistical analysis. Alex has a PhD in Statistics and an MSc in Humanities. Before joining Stats4SD, he worked for the Universitat Politecnica de Catalunya, Barcelona Tech, and for the University of Reading.

Director and Senior Statistician
Director and Senior Statistician
Sam has over 15 years’ experience in supporting the design, implementation and analysis of quantitative research including surveys and Monitoring and Evaluation (M&E) programmes. His role is to ensure that designs address the research questions, methodological choices are robust and results are communicated clearly – for example using indicators, data visualisations and dashboards. He is also involved in developing courses and other e-learning materials for those trying to improve their skills with statistics and data handling, and is particularly interested in the use of R to ensure reproducible and robust analysis of data. Sam has an MSc in Statistics with Applications in Medicine from the University of Southampton. Before joining Stats4SD, he worked in the medical industry and at the University of Reading.

Managing Director and Senior Data Engineer
Managing Director and Senior Data Engineer
Dave is Managing Director of Stats4SD and leads the organisation’s data systems and platforms team, providing robust technical solutions to support complex data management challenges. He specialises in database management, web design, and building data collection tools with ODK to support large-scale data collection efforts. He has over a decade of experience working with large and small projects. In his work, Dave is keen on promoting the careful and considered use of technology to support the work of our partners and provides both technical expertise and an understanding of when and how technology can be brought in to improve efficiency and quality.

Statistician
Statistician
Alex provides support for statistical analysis across a wide range of topics. He is interested in creating informative and effective data visualisations, with particular pride in seeing them published in reports and other publications. He is proficient in using R for a range of applications including analysis and data manipulation, and is gaining experience in building Shiny applications and spatial analysis. He is also skilled in creating survey forms with ODK and managing their use for data collection. Alex has a BSc in Population and Geography and an MSc in Social Research Methods from the University of Southampton.