
The dashboards work at Stats4SD involves building two types of dashboard for our clients: one for managing data collection processes and the other for presenting results or indicators.
An example of the first type of dashboard is where there is a household survey running in multiple locations. As a minimum, the dashboard shows you what is going on in each location and highlights problems, such as consistently missing data, to the survey manager – who can then speak to the field staff. More sophisticated versions allow users to manage the whole survey process from start to finish.
The other type of dashboard is designed to present results or to calculate indicators from a range of data sources. Our statisticians create such dashboards using code in R and graphics in R Shiny. An example is the interactive indicator dashboard for assessing land investments (see below). In such cases, the dashboard might be stand-alone, or it might be part of a data platform. When integrated into a data platform, a dashboard may be used to present results from a survey as the data is collected (in real time) to get an idea of how results are shaping up, as well as to produce indicators from the final dataset.
Stats4SD works with the Quality of Life assessment programme of the Aga Khan Development Network, supporting the Quality of Life team on survey design, implementation using ODK and analysis of results.
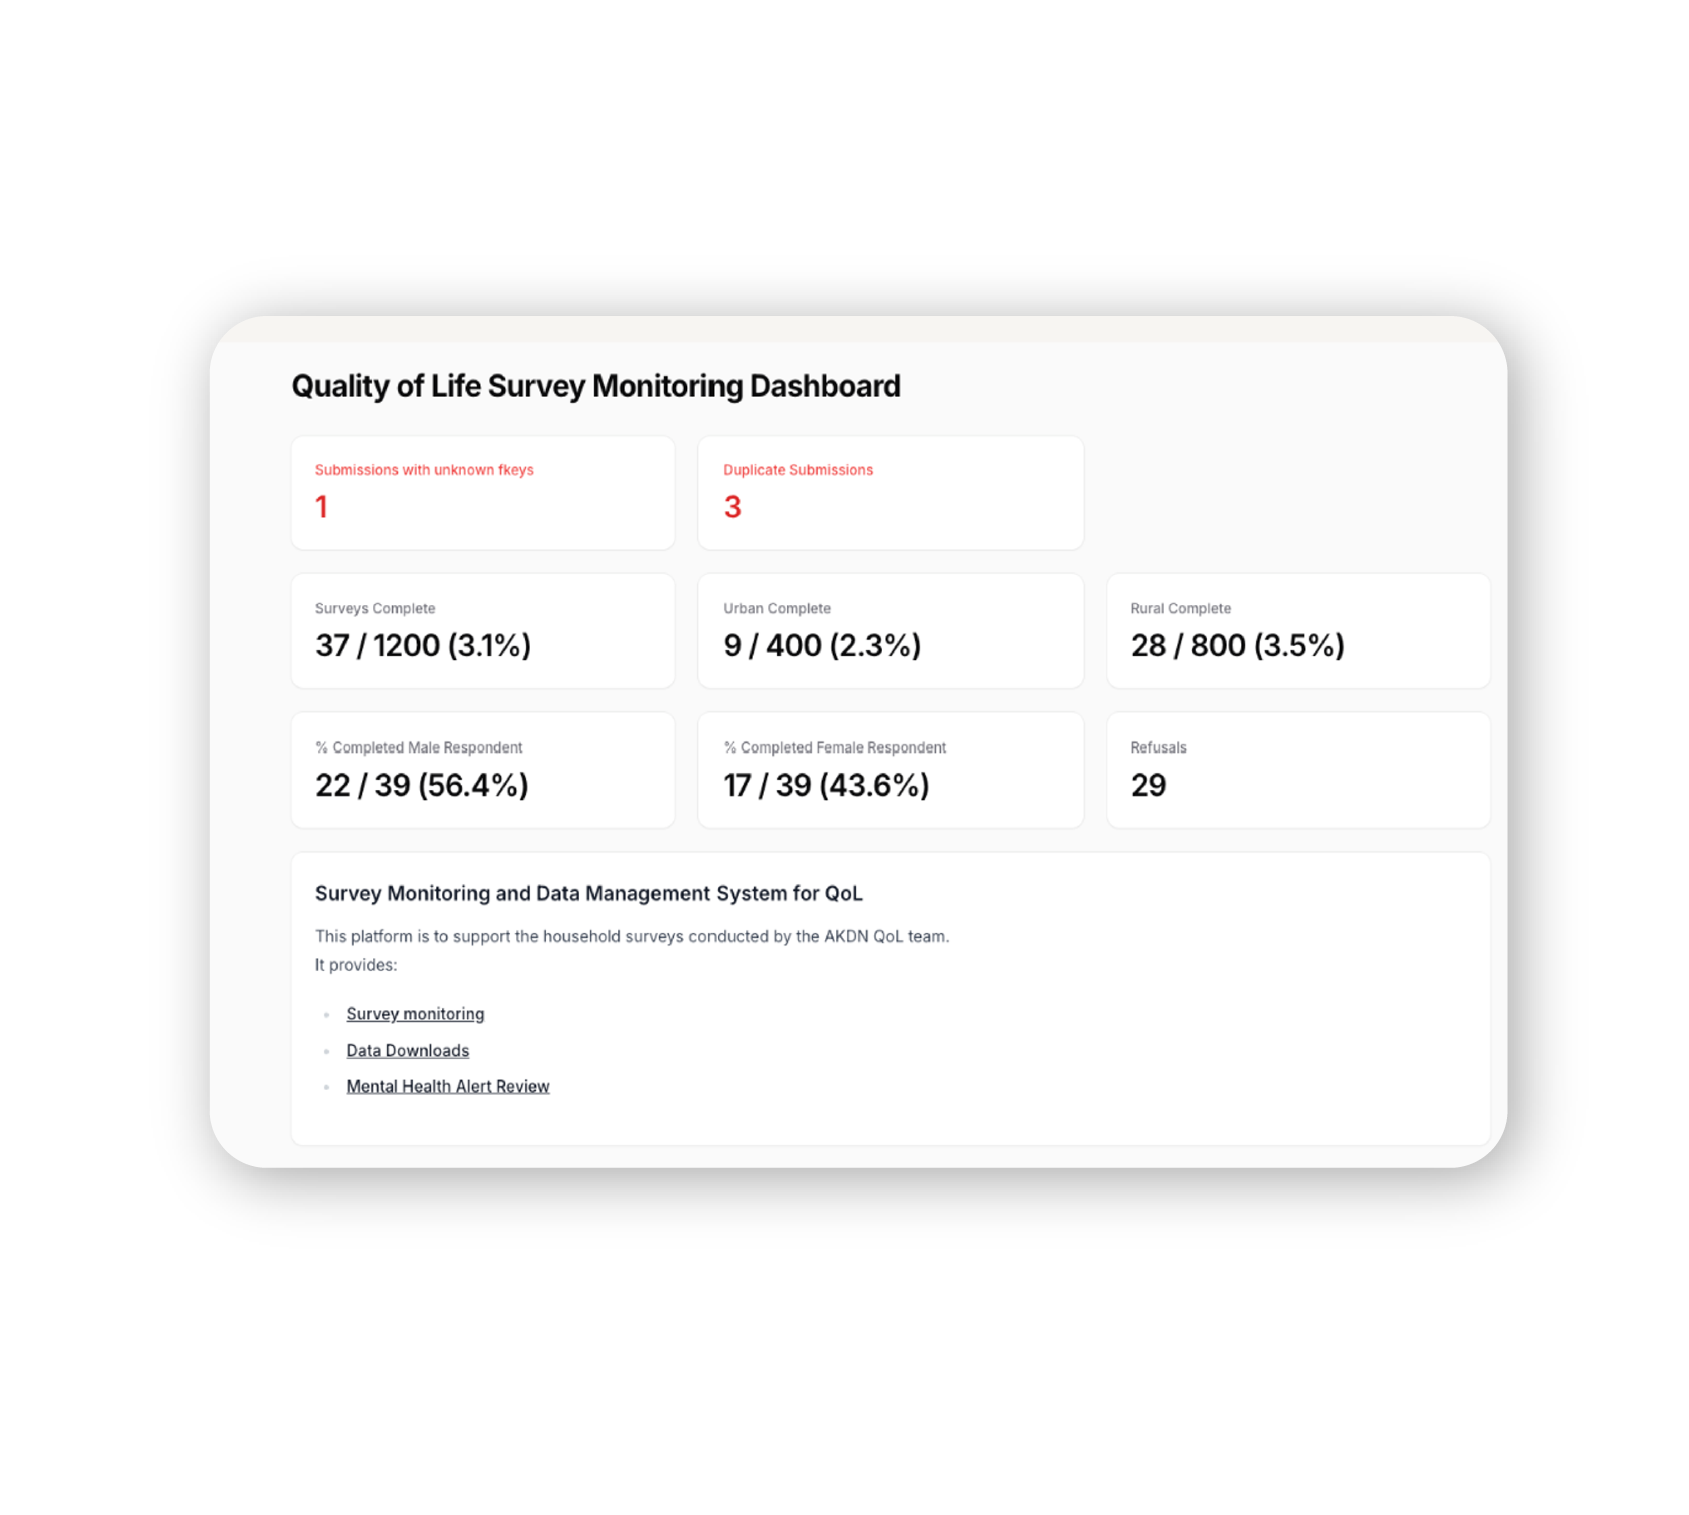
In 2021, Stats4SD built a data platform to help the Quality of Life team manage their surveys and bring data from all survey locations into one database. The platform includes a survey monitoring dashboard which allows both the field supervisors and the remote managers to track the progress of the survey from anywhere in the world.
At the top level, the survey monitoring dashboard provides a summary of progress based on key indicators that are tailored to the requirements of the survey team. It also highlights issues with the submitted data, including submissions where a household could not be identified and cases of duplicate submissions for the same household.
The data platform also includes dashboards at the levels of district, sub-district, village and household, making it possible to review the survey’s progress at each of these levels.
Users of the dashboard can delete submissions that are incorrect or update a submission to fix the incorrect data. Updates made through the platform are kept in a log, to ensure transparency. The dashboard is updated as soon as survey submissions are sent to the server, so - as long as the field staff (enumerators) can access the internet to upload their submissions regularly - the survey management team can review them and resolve any issues promptly.
Center for International Forestry Research and World Agroforestry (CIFOR-ICRAF)’s Transformative Land Investments project aims to promote land investments that adhere to agroecological principles and support sustainable food systems. The project includes supporting government officials in African and Asian countries to make better assessments of risk for proposed land investments, using a set of risk and reward indicators.
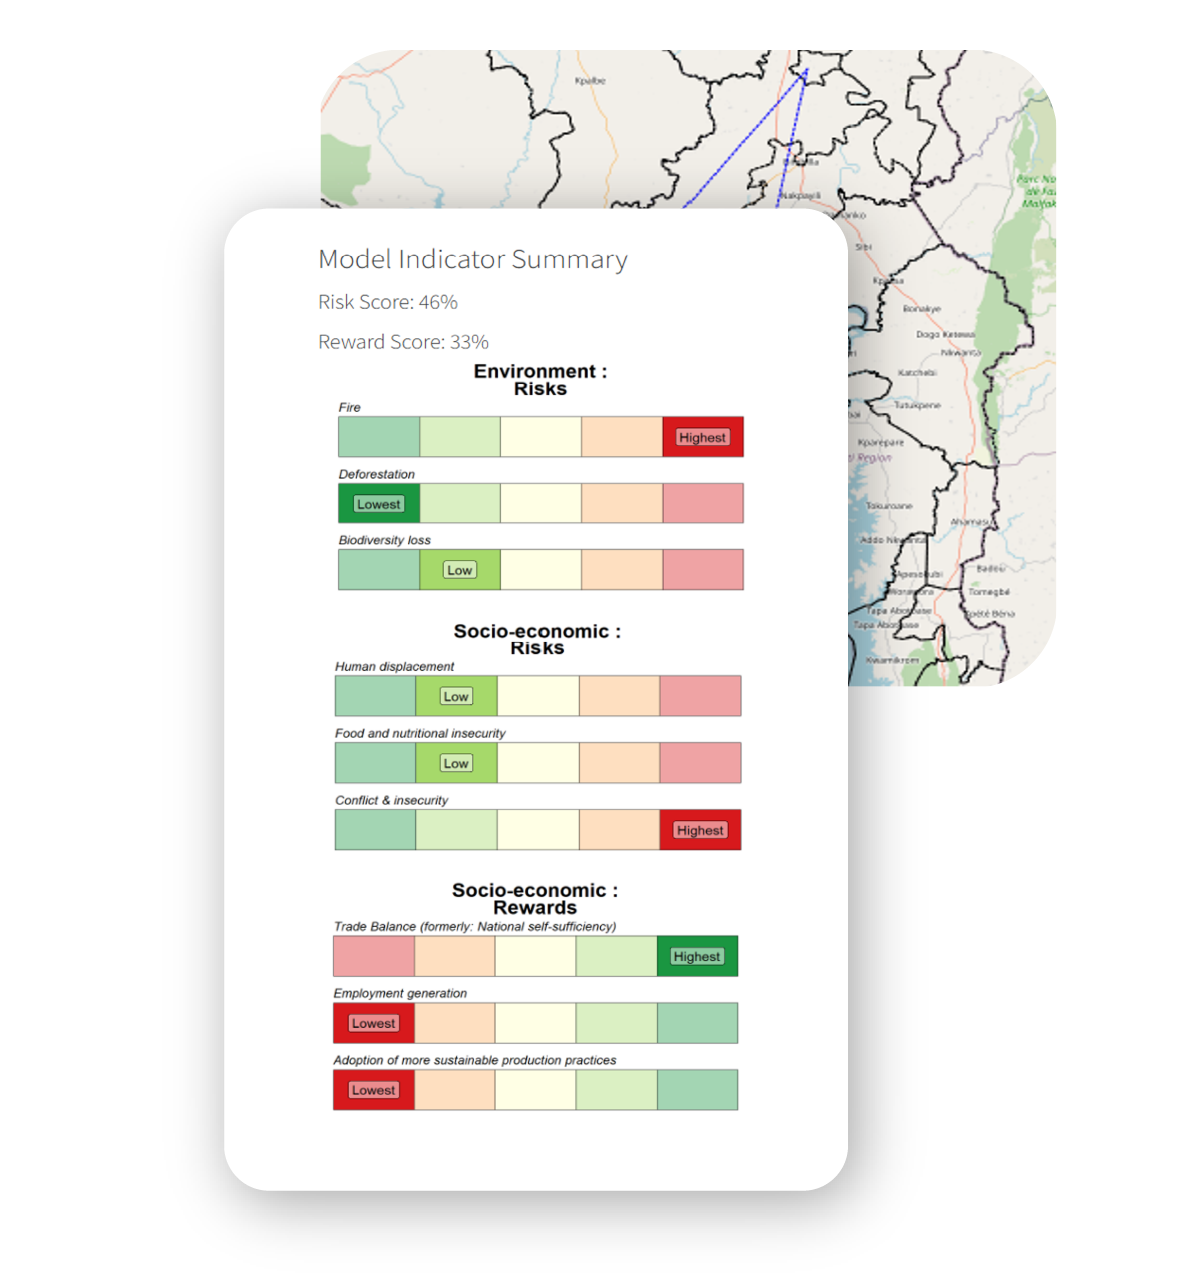
As part of this project, CIFOR-ICRAF and Stats4SD have built an interactive indicator dashboard bringing together a variety of data sources - including geospatial and population census data - so that the risks and rewards of each proposed land investment can be modelled. The dashboard was built using R and R shiny and has been developed for Ghana, Ethiopia, Mozambique and Laos.
This dashboard allows users to select a pre-defined geographical area or to draw an area on a map and then select the parameters they want to assess. The output is a report on the environmental risks and the socio-economic risks and rewards of the proposed investment.
Users of this dashboard can also alter certain conditions (inputs to the model) to explore whether doing so changes the risk-reward status of a proposal.
To learn more about how we can help you, please contact:

Managing Director and Senior Data Engineer
Managing Director and Senior Data Engineer
Dave is Managing Director of Stats4SD and leads the organisation’s data systems and platforms team, providing robust technical solutions to support complex data management challenges. He specialises in database management, web design, and building data collection tools with ODK to support large-scale data collection efforts. He has over a decade of experience working with large and small projects. In his work, Dave is keen on promoting the careful and considered use of technology to support the work of our partners and provides both technical expertise and an understanding of when and how technology can be brought in to improve efficiency and quality.

Director and Senior Statistician
Director and Senior Statistician
Sam has over 15 years’ experience in supporting the design, implementation and analysis of quantitative research including surveys and Monitoring and Evaluation (M&E) programmes. His role is to ensure that designs address the research questions, methodological choices are robust and results are communicated clearly – for example using indicators, data visualisations and dashboards. He is also involved in developing courses and other e-learning materials for those trying to improve their skills with statistics and data handling, and is particularly interested in the use of R to ensure reproducible and robust analysis of data. Sam has an MSc in Statistics with Applications in Medicine from the University of Southampton. Before joining Stats4SD, he worked in the medical industry and at the University of Reading.